An encyclopedia of cancer cell lines
February 04, 2020
Introduction
Finding cancer treatments is a very difficult task. Rather than a single disease, cancer describes a vast array of disorders, all defined by the common trait of revolt against the ancient covenant of multicellularity. The first step towards unlocking potential treatments is to understand the precise disruptions to the cell that enable such malignant behavior.
A key difference between cancer cells and normal ones are certain genomic alterations – for instance, deletions of genes responsible for monitoring DNA repair or mutations that lead to hyperactive growth factor proteins. However, to paint a clearer picture of what goes wrong, orthogonal panels are also incredibly valuable. For instance, gene activity is often modulated by alterations beyond the DNA level, such as through methylation. Moreover, measurements like RNA and protein expression provide hints to the immediate effects of genomic alterations on gene activity, allowing us to connect the links to achieve a more thorough and useful understanding of the disease.
Besides looking at these static properties of tumors, it is also vital to find ways to connect such biomarkers to actual treatments. To test treatments before opening them to clinical trials or even mice, we often employ cancer cell lines: collections of cells that have been isolated from a patient’s tumor and immortalized in the laboratory. These cell lines are a key component towards making much of modern drug testing and functional profiling possible.
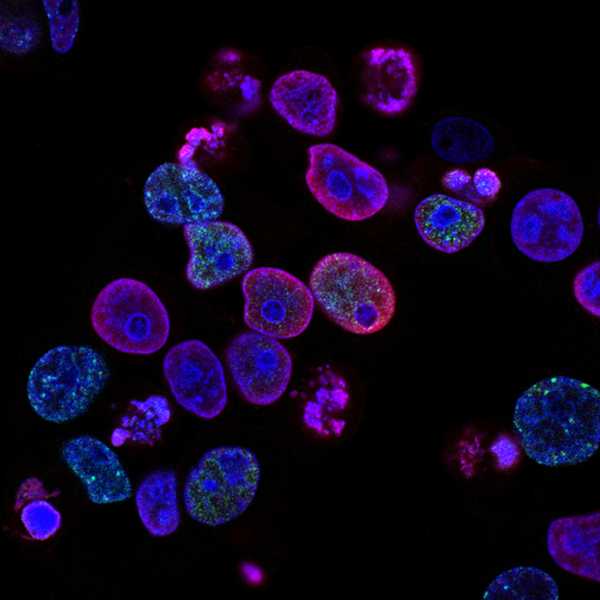
Human colorectal cancer cells treated with a topoisomerase inhibitor and an inhibitor of the protein kinase ATR (ataxia telangiectasia and Rad3 related), a drug combination under study as a cancer therapy. Source: National Cancer Institute.
Since the development of the famous HeLa cell line in 1951, thousands of lineages have been developed and used across the research community. (Note that not all cell lines are cancer cell lines – certain normal cell types, such as stem cells, can also be made immortal in isolation). To provide a unified and comprehensive reference of cell line activity, the Cancer Cell Line Encyclopedia (CCLE) was established in 2012 with mutation, expression, and drug profiling data for over a thousand cell lines. Since then, it has seen widespread usage as a reference for cell line research, and thousands of studies have repurposed CCLE data to advance our knowledge of cancer.
In addition to these massive genomics datasets, teams at the Broad Institute and beyond have also developed sequencing-based techniques for assessing the effects of perturbing thousands of genes across cell line pools. In doing so, we measure how sensitive a particular cell line is to the inactivation of a particular gene, which combined across thousands of genes and cell lines allows us to see a landscape of vulnerabilities: a dependency map. In particular, two technologies have been applied to create these pools: RNA-interference (RNAi) and CRISPR-cas9. RNAi screens have been used to create the DRIVE and Achilles panels, whereas CRISPR-cas9 ones have been used to create the Avana and Score ones. Equipped with these sensitivity measurements, we can hone in on the genes that display unique and specific vulnerabilities in cancer. Moreover, by combining gene sensitivity measurements with genomic profiling, we can identify the specific mutations that lead to vulnerabilities in these genes, which may allow us to develop and better target drugs through personalized medicine.
CCLE2
Techniques in biotechnology move at an incredible pace. Using several recent technologies, we recently published and released the first major update to the CCLE since its inception in 2012. In our manuscript, we expand and further characterize the CCLE with several new assays, which include deep RNA sequencing, DNA methylation, chromatin modification, microRNA expression, and protein expression measurements. In particular, we compared several orthogonal sets of biomarkers against each other to derive compelling genomic insights, offering new clues to the many origins of cancer as well as potential avenues for treatment. For a walkthrough of the code used to produce the main figures, see the associated repository.
The paper
Figure 1: An overview

The purpose of the first figure in a paper is usually to provide the reader with an overview of the study at hand. In this case, we wanted to highlight the sheer volume of data across the many annotations at our disposal. In this plot, our cell lines and their associated values are represented as a series of tables and heatmaps: each row corresponds to an individual cell line out of a total of 749, and columns represent individual measurements for the various annotations at our disposal.
To create this figure, we first grouped cell lines by their cancer type (as indicated at the far left). For each cancer type, we then averaged their numerical profiling values shown in the heatmaps, after which we applied a hierarchical clustering technique to group similar cancer types together.
We then decided to display the following datasets that our paper makes public, from left to right:
- Mutations: By applying a combination of whole-genome sequencing (WGS), whole-exome sequencing (WES), as well as RainDance-targeted sequencing of known genes of interest, we were able to call mutations in tens of thousands of genes as well as in noncoding regions (with WGS). In this figure, we highlight the mutations in several genes of particular interest to cancer research:
- TP53: Often called the "guardian angel of the genome," TP53 encodes p53, a key tumor-suppressor protein that is the most frequently mutated gene in cancer.
- CDKN2A: This gene, whose full name is "cyclin-dependent kinase inhibitor 2A," encodes a protein responsible for regulating the cell cycle and the second most frequently mutated gene in cancer.
- KRAS: This gene encodes the K-Ras protein, which regulates various growth factors through the famous MAPK/ERK pathway. Mutations in KRAS often lead to a hyperactive protein that drives uncontrolled cell growth.
- BRAF: Similar to KRAS, BRAF also modulates cell growth via the MAPK/ERK pathway. BRAF mutations, in particular the V600E variant, likewise result in a hyperactive protein.
- NRAS: Also similar to KRAS as another member of the RAS gene family, mutations in NRAS drive abnormal cell growth.
- PIK3CA: Mutations in this gene lead to activation of the PI3K/AKT/mTOR pathway, which also stimulates growth.
- EGFR: This gene encodes an important protein called the epidermal growth factor receptor. Normally, EGFR requires the epidermal growth factor to become active; however, mutated versions in cancer are constitutively activated, or independently active in the absence of its ligand.
- TERT promoter: TERT encodes the protein subunit of human telomerase, the enzyme responsible for maintaining our telomeres, repetitive nucleoprotein complexes at the ends of chromosomes that prevent our chromosomes from sticking together. However, TERT is silent in most adult cells, instead being active typically only in stem cells. Unlike all of the other genes in this list, TERT promoter mutations do not affect the produced protein itself. Instead, they create transcription factor binding sites in the upstream DNA (or promoter), allowing cancer cells to upregulate this vital gene and avoid/escape telomere crisis.
- Fusions: Our sequencing efforts also allowed us to identify cases in which genes have become glued together by the breaking and rejoining of chromosomes (a common trait of cancer is genomic instability). Oftentimes these fusions result in new and hyperactive proteins that drive increased cell growth. Here, we highlight three well-known fusions:
- BCR-ABL1: Perhaps the most famous fusion, the BCR-ABL1 fusion gene leads to the production of a hyperactive tyrosine kinase signaling protein that is noted for causing chronic myelogenous leukemia (CML). It is often seen in cells with the Philadelphia chromosome abnormality.
- EWSR1-FLI1: This fusion leads to abnormal activity in both genes. FLI1 is responsible for the regulation of DNA transcription, and EWSR1 can also activate DNA transcription as well as bind to RNA. The fusion product is especially prevalent in Ewing's sarcoma, for which EWSR1 was named.
- KMT2A-MLLT3: KMT2A, which stands for histone lysine methyltransferase 2A (the amino acid symbol for lysine is K), is an important positive modulator of gene expression. MLLT3 is part of a protein complex that helps increase the rate of RNA transcription.
- Copy number: Besides mutations, cancer cells often conbtain variable copies of genes. For instance, cells that are not mutated in TP53 or CDKN2A often instead lack one or more copy, compared to the standard two in normal cells. Likewise, genes that are key to cell growth, such as MYC, TERT, and KRAS, are often duplicated, or amplified, up to hundreds of times.
- DNA methylation: Cells often regulate gene activity through the attachment of methyl functional groups to DNA, which results in the compacting of chromatin and acts as a silencer of expression. We used a technique called reduced-representation bisulfite sequencing to estimate methylation levels at hundreds of thousands of sites across the genome, which along with gene expression estimates allow us to pinpoint silenced and activated genes in cancer.
- mRNA expression: By sequencing the RNA of cells, we can get a sense of which genes are expressed and which are not, allowing us to see which genes are activated or silenced in cancer.
- Alternative splicing: In eukaryotic cells, RNA is first spliced before it is finally translated into proteins. RNA sequencing also allows us to look at these different versions of RNA and elucidate the misregulation of RNA splicing in cancer.
- miRNA expression: miRNAs, which are short for microRNAs, are short (~20 nucleotide) RNAs that play a significant role in the regulation of gene expression. Several miRNAs have been observed to play a role in cancer; for instance, miR-34a has been shown to play a part in the p53 pathway.
- Chromatin profiling: DNA is packaged in the cell through an extremely elaborate system of proteins, the most abundant and important of which are histones. Chemical modifications to the "tails" of histones by other proteins control the shape and structure of DNA and thus its ability to be transcribed into RNA, therefore having a direct impact on gene activity. We used mass spectrometry to measure the overall abundance of these chemical modifications in nearly a thousand cancer cell lines, allowing us to link certain modification patterns to specific mutations in chromatin-remodeling genes.
- Protein expression: Although gene expression is usually a fair indicator of the abundance of the final protein product, mechanisms of post-transcriptional regulation mean that this is not always the case. For instance, proteins may be chemically modified, such as phosphorylated, to activate them. Here, we used a method called the reverse-phase protein array (RPPA) to quantify the expression levels of several hundred proteins of interest across nearly a thousand cell lines.
- MSI: A subset of cancer cells exhibit a striking pattern of hypermutation in which defects in the DNA repair machinery lead to abundant errors in microsatellites: short tracts of repetitive DNA. We used our sequencing measurements to investigate these mutations and classify cell lines as affected by this MSI, or microsatellite instability, abnormality.
- Ploidy: Normal human cells feature two copies of each chromosome – one from each parent. However, cancer cells, in addition to a litany of other genetic abnormalities, frequently feature duplications or deletions in their entire genomes. Ploidy is also important to keep track of because we often normalize copy number variations relative to ploidy in cancer.
- Ancestry: Ethnicity plays a significant role in our understanding of cancer. In addition to cancer subtypes being highly unevenly distributed among different ancestries, a greater understanding of the complex relationship between ethnicity and cancer is key to helping address the numerous disparities in healthcare among those of different races.
Combined, these twelve panels provide us with a remarkably detailed profile of each cell line, and by cross-referencing them we discover a multitude of new and interesting insights.
Figure 2: Methylation and dependency


To start, we take a look at the relationships between DNA methylation and gene sensitivity scores. Cancers often modulate gene expression through methylation, which may result in unique vulnerabilities. In this panel, we perform a global search for vulnerabilities associated with methylation, and in the subsequent panels we highlight the specifics of a few strong examples.

In Panel A, we present a volcano plot detailing the associations between selected gene pairs (from the STRING database), where we compare the methylation levels of one gene to the sensitivities of another. On the x-axis, we plot the Pearson correlation between these methylation-sensitivity pairs, and on the y-axis, we plot the respective statistical significance. Among these pairs, we found several particularly strong associations that we clarify in the subsequent panels.
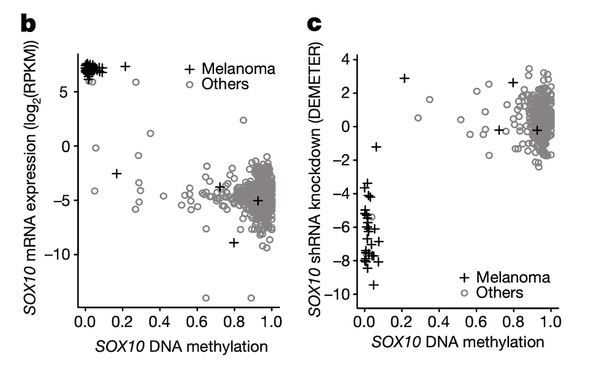
In Panel B and Panel C, we highlight the first of these associations: SOX10 methylation is strongly associated with SOX10 dependency. In Panel B, we first plot SOX10 methylation against its mRNA expression levels. As we can see, a few cell lines, nearly all of which are melanomas, have completely demethylated SOX10 in concert with vastly upregulated expression levels. The functional consequence of this upregulation is then shown in Panel C, where mRNA expression is replaced with the sensitivity of each cell line to knockdown (RNAi-mediated inactivation) of SOX10 – the more negative a sensitivity value is, the less viable a cell line is following SOX10 inactivation. Importantly, we see that these same melanomas that upregulate SOX10 through demethylation are now hypersensitive to SOX10 inactivation, making it a potential drug target in this subclass of cancers. Since SOX10 has been previously characterized as being involved in embryonic development, it is likely playing a role in driving the proliferation of these melanomas.
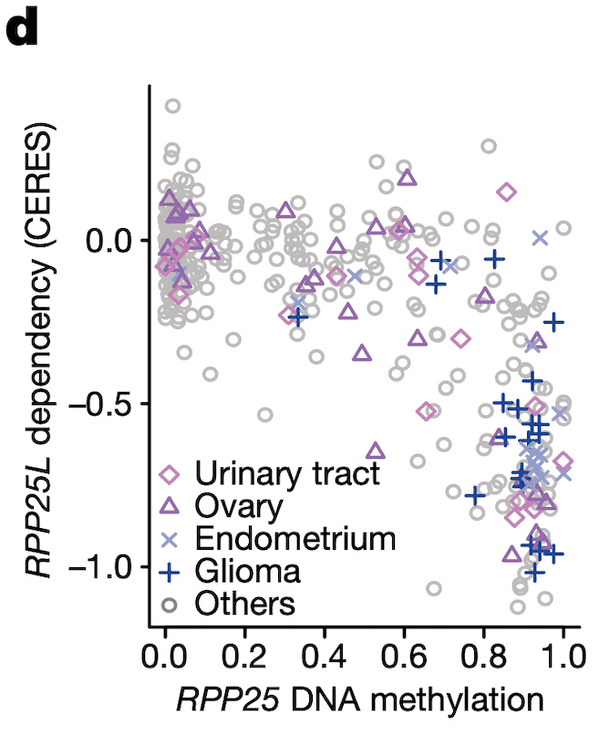
In Panel D, we show a similar relationship as in Panel C. Here, we show that increased methylation in RPP25, a gene involved in the processing of essential transfer RNA (tRNA) molecules as part of RNase P, is associated with increased sensitivity to its paralog (a separate gene that occurred from a past duplication) RPP25L. The likely mechanism of action here is that methylation of RPP25, perhaps as a side-effect of a general methylation abnormality, leads to silencing of RPP25. The cell then has to compensate for reduced levels in RPP25 through RPP25L, which is functionally redundant, making these cell lines sensitive to RPP25L inactivation. Note that we measure RPP25L sensitivity here using the Avana panel, which in contrast to the RNAi-based DEMETER panel of Panel C is based on CRISPR-cas9 knockouts.
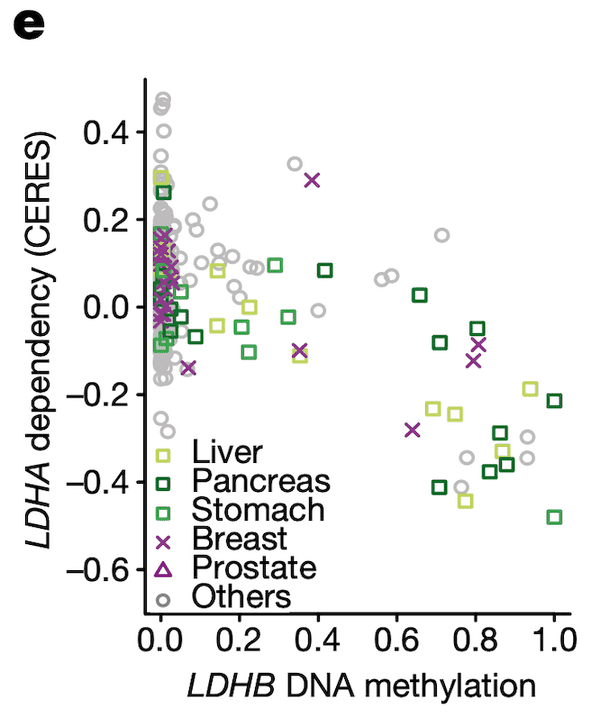
In Panel E, we highlight a similar paralog relationship between LDHB and LDHA, which encode lactate hydrogenase genes that are involved in the essential conversion of pyruvate and lactate as well as NADH and NAD+ as part of glycolysis. In a similar theme to Panel D, we see that increased methylation of LDHB leads to increased sensitivity of its paralog LDHA, likely through the same mechanism as detailed in our above explanation of Panel D. The discovery of this synthetic lethality relationship between LDHB and LDHA is of particular therapeutic interest given the fact that tumor cells are preferentially dependent on anaerobic glycolysis as opposed to the cellular respiration (mitochondria-driven) that powers most cells.
Figure 3: Chromatin modifications and mutations
Having explored methylation, we now turn our eye to another facet of epigenetics: global chromatin modifications. In this heat map, we plot the matrix of chromatin modifications (rows, labels on right) across several cell lines of interest (columns, labels at the bottom). We group cell lines of a similar chromatin state together through hierarchical clustering. At the top, we indicate the presence of mutations in four chromatin-modifying genes that we found to be significantly associated with a certain cluster, suggesting that these mutations may be partly responsible for these distinct chromatin modification patterns.

To better understand the modifications that we are plotting here, let's dissect how each histone label is structured with the example of the first modification, H3K18ac0K23ac0:
- The first part, H3, tells us the subunit type (histones are each composed of eight subunits, of which there are five different main types).
- The second part, K18, tells us the amino acid of the histone that is being modified. In this case, it is the 18th lysine (amino acid symbol K).
- The following part, ac0, stands for zero acetylation, which is the chemical mark being measured.
- The remaining portion, K23ac0, is structured the same as the two parts we just went over: it tells us that this histone also has no acetylation on lysine 23.
- Combined, we see that this mark indicates the relative concentration of H3 histone variants that have no acetylation on lysines 18 and 23.
Using this language, we can see that the other marks abbreviations indicate as well; note that me stands for methylation (histones, like DNA, can also be methylated, often also with a silencing effect).
Now looking across the chart, we see that there are four broad groups of cell lines that we have found clusters for. In each of these clusters, we also show the mutation status of a particular set of genes at the very top of the heat map. Let's break down the meaning of these clusters, moving from left to right:
- The first cluster shows a group of cell lines all with GOF (gain-of-function) mutations in the EZH2 chromatin modifier. In this case, we found that these mutations appear to correspond to slight differences in the bottommost chromatin marks compared to the others.
- The second cluster shows a set of cell lines with particularly strong reductions in H3K27me2 marks as well as marked increases in H3K27me0 and H3K27ac1 marks. Some of these cell lines also have LOF (loss-of-function) mutations in EZH2.
- The third cluster highlights a large group of cell lines with hotspot (highly common) mutations and fusions of the NSD2 chromatin modifier. Here we see that these cell lines have reductions in a certain set of chromatin marks. Note that the NSD2 finding is not without precedent – it was reported in 2013 using a preliminary version of our current chromatin profiling dataset.
- The fourth and last cluster highlights the most novel finding of this panel. Among this set of cell lines with strong enrichment in H3K27ac1, H3K18ac1K23ac0, and H3K18ac1K23ac1 marks, we find enrichment of truncating, or frameshift, mutations in the EP300 and CREBBP chromatin modifiers.
All in all, this figure shows that we can integrate chromatin profiling and mutation panels to link specific mutations in chromatin-modifying genes to abnormal levels of chromatin marks, furthering our understanding of gene regulation in cancer.
Figure 4: MDM4 splicing
In this large figure, we highlight our findings surrounding the splicing patterns of MDM4. This was the part of the project that I was personally involved in the most: I discovered the relationship between MDM4 splicing and RPL22L1 expression.
Before we walk through this figure, it is important to give some background on why MDM4 is of special interest to cancer researchers. As explained earlier in Figure 1, mutations and copy number deletions of the TP53 tumor suppressor make it the most frequently inactivated gene in cancer. However, TP53 itself is also regulated by genes that control the extent to which it can survey cellular damage – in the absence of these regulators, a hyperactive TP53 restricts cell growth to the extent that organisms cannot survive embryogenesis. As a result, an alternative mechanism for disabling TP53 in tumors is to leave it intact, but upregulate the genes that suppress TP53. Two such genes that exhibit this pattern are MDM2 and MDM4, and inhibitors of their respective proteins are being explored as possible anti-tumor therapies by inducing reactivation of TP53.

With that said, let's go through the panels:
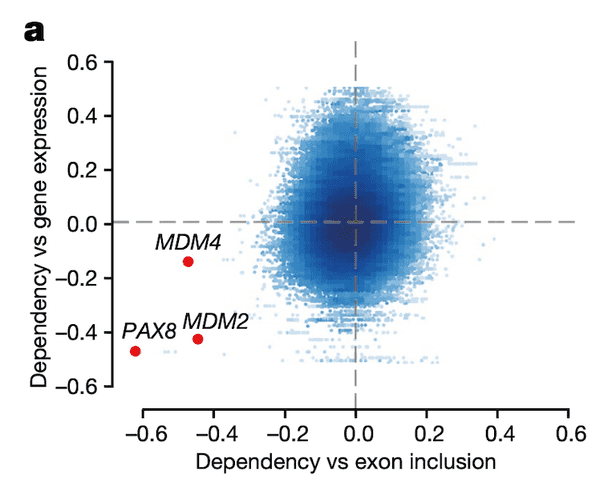
In Panel A, we provide our rationale for exploring MDM4 splicing in the first place. In a preliminary analysis, we computed the correlation between each gene's expression and dependencies. Whereas for several genes we find that gene expression is a robust predictor of dependency (for instance, recall from earlier the example of SOX10 gene expression and dependency), we found a few genes for which splicing levels of a particular exon were a better indicator. This suggests the presence of a splicing-mediated "switch" that could be a closer link to the function of the gene than expression alone. We highlight three genes here: PAX8, which encodes an important master embryonic transcription factor; and the two TP53 suppressors mentioned above: MDM2 and MDM4. Among these three genes, only MDM4 displayed a low correlation with its gene expression despite a high correlation with exon inclusion, which motivated us to take a closer look.
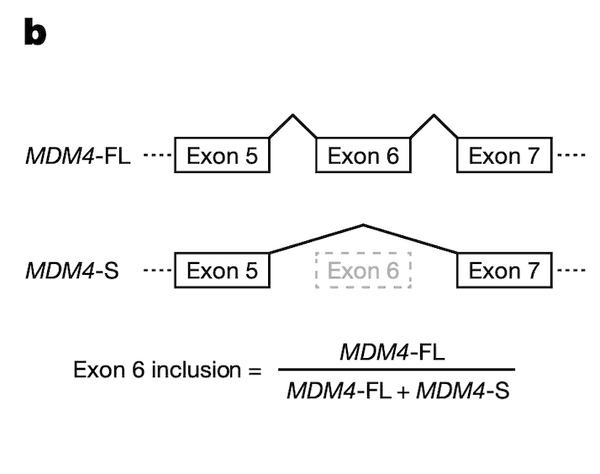
In Panel B, we provide a schematic of the particular exon in MDM4 that is so highly associated with MDM4 dependency. There are two splice variants, or isoforms, of MDM4: a full-length (FL) one that contains the 6th exon, and a short-length (S) one that does not. Because excluding exon 6 leads to a nonfunctional protein, we see that exon 6 indeed acts as a necessary switch for MDM4 function. As such, we compute the inclusion level of exon 6 as the ratio between the full-length isoform and the sum of both isoforms.
Note that the idea of MDM4 function being dependent on this splicing switch has been detailed previously, but its functional importance in cancer had not yet been highlighted on this scale.
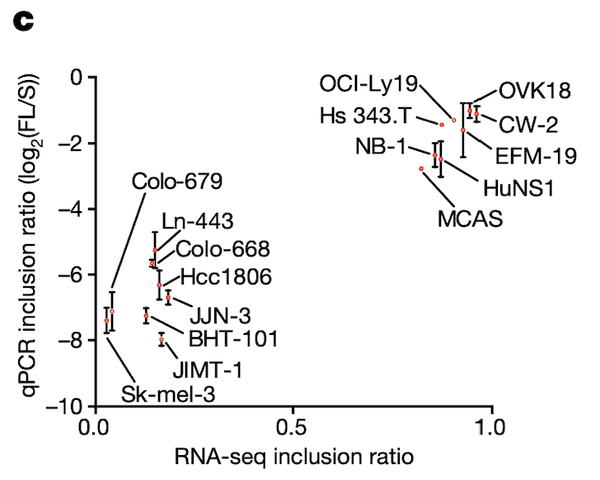
In Panel C, we provide support for the fidelity of our MDM4 splicing estimates, which had been computed from RNAseq runs. Here, we use a "gold standard" method called quantitative polymerase chain reaction (qPCR) to measure MDM4 exon 6 splicing levels in several test cell lines, and we compare these values to the ones we have from RNAseq data. On the whole, we see relatively good agreement between the two methods of measurement: cell lines that have a low MDM4 exon 6 inclusion as estimated by RNAseq also have a low exon 6 inclusion as estimated by qPCR, and a similar agreement holds for high-inclusion cell lines.
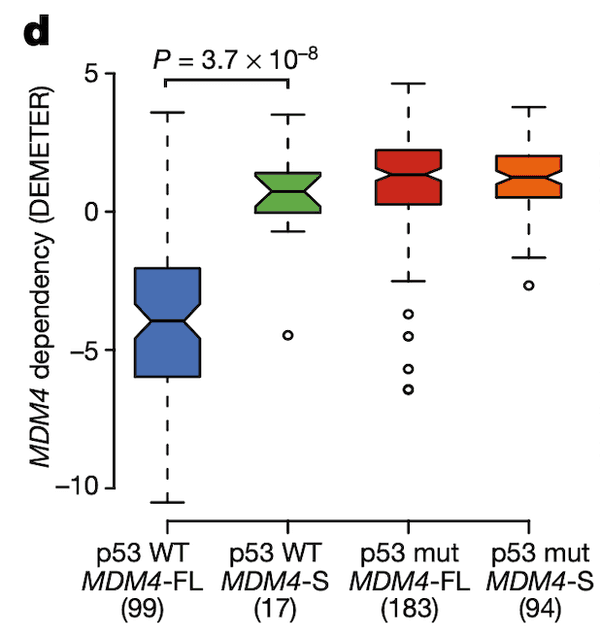
In Panel D, we show a box plot of MDM4 dependency across cell lines stratified by MDM4 exon 6 inclusion level and TP53 (whose protein product is referred to as p53) mutation status. Across these categories, we see what we would expect given our knowledge of the MDM4-p53 pathway: cell lines with a wild-type (non-mutant) p53 and MDM4-FL are highly sensitive to MDM4 inactivation as shown by negative values, whereas the other categories are all relatively insensitive. This provides strength to our hypothesis that MDM4-FL indeed helps cancer cells by inactivating p53, and MDM4 insensitivity is thus dependent both on the splicing level of MDM4 as well as the mutation status of p53.
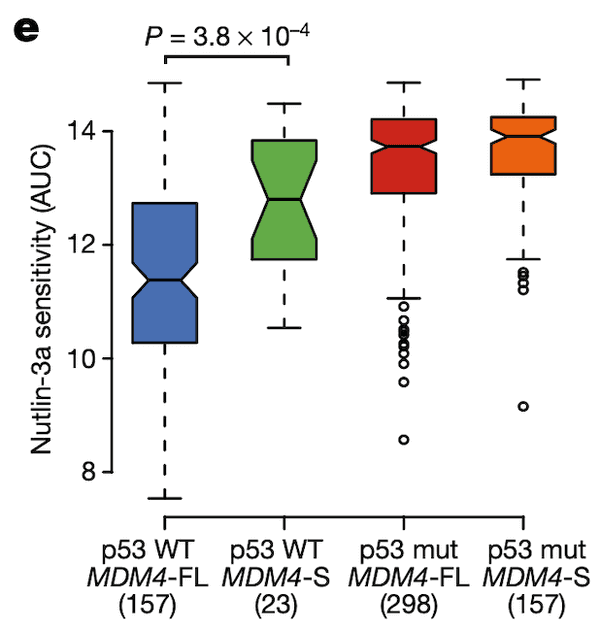
In Panel E, we show the same format as for Panel D, except the y-axis has been replaced with the drug sensitivity values of Nutlin-3, an MDM2/MDM4 inhibitor. The AUC statistic quantifies the sensitivity of a cell line to a drug by measuring the cumulative fraction of cells surviving as the drug dosage is increased; thus, lower AUC values reflect higher sensitivity to the drug. We see the same pattern as in Panel D: only cells that are p53-wildtype and MDM4-FL are sensitive to this inhibitor of MDM4.
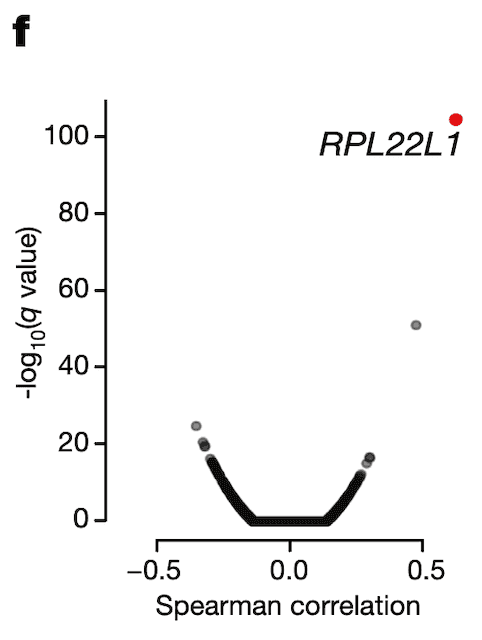
In Panel F, we use our splicing estimates of MDM4 and correlate those with gene expression estimates for every single gene profiled through RNAseq. We find one gene whose expression associates particularly strongly with MDM4 splicing levels: RPL22L1, a gene whose encoded protein is a component of the ribosome.
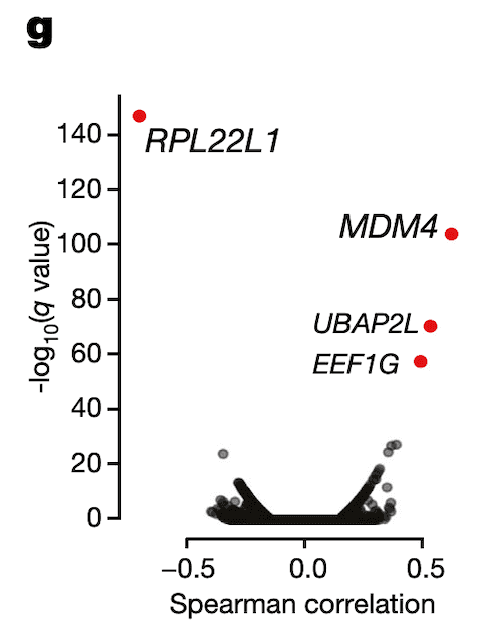
In Panel G, we perform the inverse of Panel F: we correlate RPL22L1 gene expression estimates with every single exon splicing estimate that we have. Encouragingly, we find that besides an exon contained in RPL22L1 itself, MDM4 exon 6 is among the top splicing events correlated with RPL22L1 gene expression.
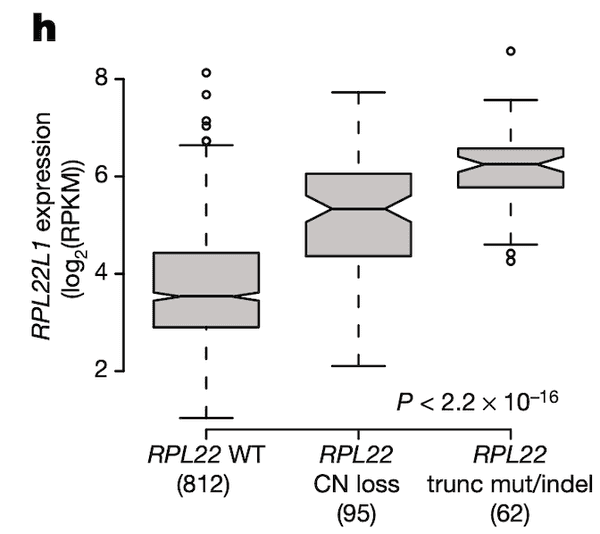
In Panel H, we take a look back at what we think might be regulating RPL22L1 gene expression. It has been shown that RPL22L1 expression is often increased as a direct result of RPL22 deactivation, the reason being that RPL22L1, whose full name is RPL22-like 1, is a substitute for RPL22. Both genes encode a necessary component of the ribosome, without which cells cannot convert RNA to protein. However RPL22 is frequently damaged by mutations and deletions in cancer cells, compelling cells to upregulate RPL22L1 as a substitute. In this figure, we take a closer look at RPL22L1 RNA expression in the context of RPL22 status and show what would be expected – namely, in cell lines with copy number (CN) loss or truncating mutations/deletions in RPL22, we see elevated RPL22L1 expression relative to RPL22-wildtype lines.
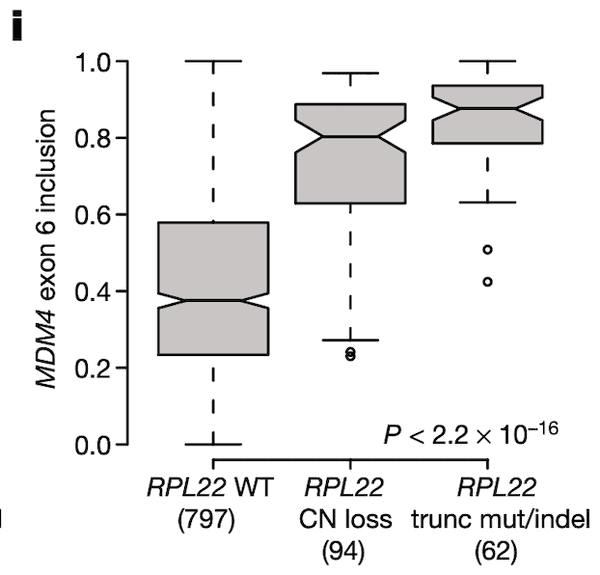
In Panel I, we suggest that RPL22 mutations and deletions might also play a role in MDM4 exon 6 splicing given the association between RPL22L1 expression and MDM4 splicing that we discovered earlier. The format of this plot is the same as Panel I, with the y-axis now being MDM4 splicing rather than RPL22L1 expression. We see what we would expect given our prior findings – cell lines that have a defect in RPL22 have elevated levels of MDM4 exon 6 inclusion.
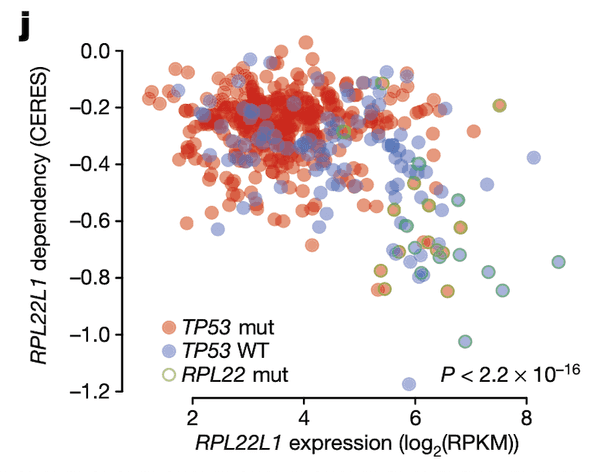
Finally, in Panel J, we show that the relationship between RPL22L1 gene expression and RPL22L1 dependency, while itself correlated, is also explained by incorporating TP53 and RPL22 mutation statuses. Given our knowledge of how and why RPL22L1 expression is elevated – namely, that it acts as a substitute for defunct RPL22 – we would expect cell lines with elevated RPL22L1 expression to also be sensitive to loss of RPL22L1, as they now depend on it for functional ribosomes. Here, we show that this is indeed the case using CRISPR-cas9 gene dependency estimates from the Avana project estimated using the CERES algorithm. Cell lines with high RPL22L1 expression (x-axis) indeed have high sensitivities to RPL22L1 (y-axis, lower values indicate greater sensitivity to RPL22L1 depletion). Moreover, this relationship is also confounded by TP53 status (blue and red colors), suggesting that RPL22 mutations (green outline) might be selectively acting in TP53-wildtype tumors to suppress TP53 via increased MDM4 exon 6 splicing. RPL22 mutations are not an uncommon occurrence: in fact, they are among the most frequent mutations in tumors with a microsatellite-instability (MSI) phenotype.
Figure 5: SHP2 phosphorylation
In our final figure, we take a look at protein expression as well as the only in vivo experiments described in this manuscript. In particular, we focus on the Shp2 protein, which functions as a signaling protein involved in the regulation of cell growth. Of particular note here are different forms of Shp2: the unmodified normal version (which is enzymatically inactive), and a chemically-modified phosphorylated form that is more active. As it so happens, the phosphorylated form, which is labeled SHP2.pY542 (as it is phosphorylated on amino acid #542, a tyrosine with symbol Y), is part of our RPPA protein panel, and we now take a closer look.

Let's walk through the panels:
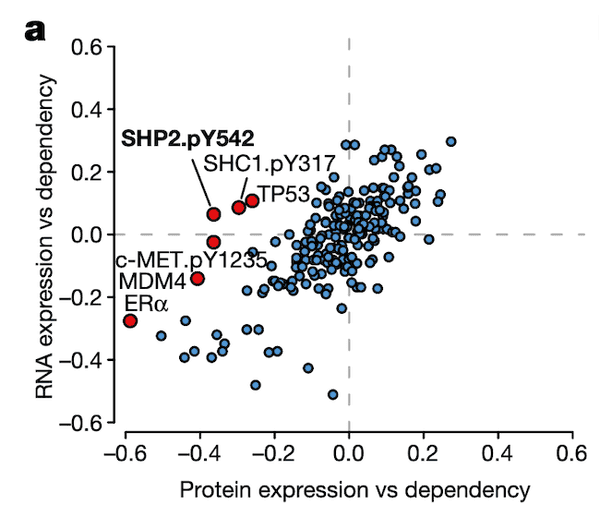
In Panel A, we show a similar plot as in Figure 4A. The difference here is that instead of splicing, we use protein expression. In this case, we want to highlight genes that are more strongly associated with their protein expression than their gene expression, which hints that some post-translational mechanisms may have an impact on the gene's function. Here, we see that although the correlation between SHP2 gene expression and dependency is less than 0.1, there is a much stronger -0.4 correlation between SHP2 dependency and protein levels of the SHP2.pY452 variant. The biological interpretation here follows from our understanding that the SHP2.pY452 variant is the active form, and it therefore does not matter how much SHP2 mRNA is transcribed, but rather how much is later phosphorylated.
We can also see some other familiar genes here such as TP53 and MDM4. Notably, the MDM4 association also extends our finding in Figure 4 by hinting that a post-translational mechanism – which we believe is RNA splicing – is ultimately responsible for MDM4 mRNA expression levels being poorly correlated with MDM4 dependencies. In particular, MDM4 dependency is still highly correlated with its protein levels.
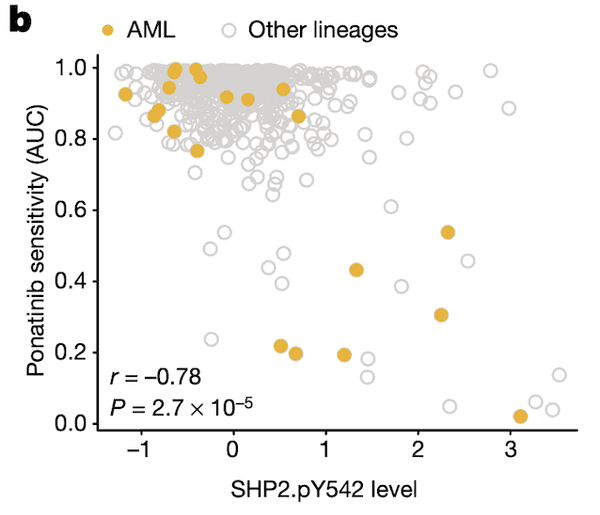
In Panel B, we show that SHP2.pY542 levels are interestingly indicative of sensitivities to ponatinib, a drug developed for the treatment of acute myelogenous leukemia (AML). Ponatinib is one of the drugs that target the protein encoded by the BCR-ABL1 fusion gene, and we show here that cell lines with high SHP2.pY542 levels are also vulnerable to ponatinib treatment (recall from our nutlin plot that AUC, or area-under-curve, indicates the cumulative fraction of cells surviving as the dosage of ponatinib is increased).
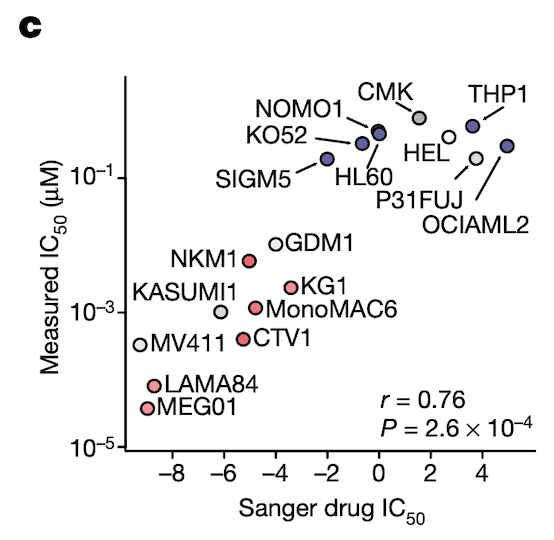
In Panel C, we perform validation experiments to show that our measurements of ponatinib levels are robust. Just like our qPCR experiments in Figure 4C, here we measure the IC50 of ponatinib (the dosage at which half the cells are killed) in various labeled cell lines. We compare these IC50 values to those previously measured in the Sanger GDSC drug panel.
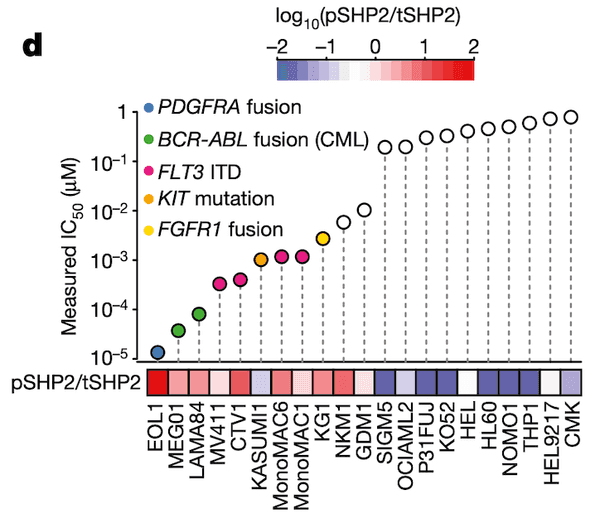
In Panel D, we take our measured ponatinib IC50 values and compare those with the ratio of SHP2.pY452 (which we abbreviate pSHP2) to normal tyrosine SHP2 (which we abbreviate tSHP2). As we can see, the cells with a higher relative amount of pSHP2 to tSHP2 on the left are also highly sensitive to ponatinib, as smaller amounts of the drug are sufficient to cause half the population to die off. In contrast, the cell lines in the right half have low pSHP2:tSHP2 levels and do not respond to ponatinib. Moreover, in the lollipop plot, we also color several genetic alterations to relevant pathways that we believe might be responsible for high pSHP2 concentrations, namely several fusions and mutations.
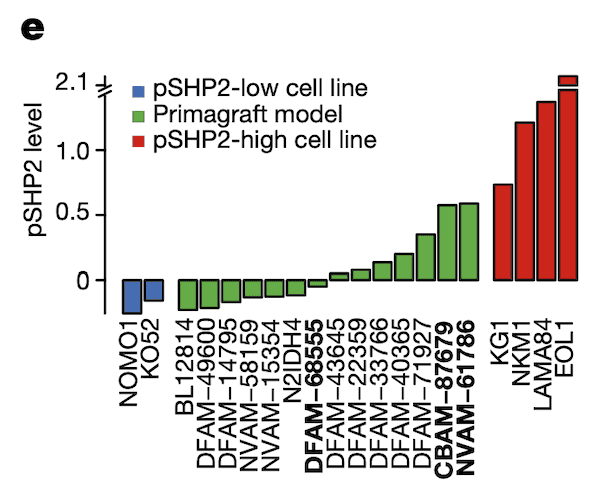
In Panel E, we measure pSHP2 levels in several mouse primagrafts, or mice implanted with cancer. This shows a wide range of SHP2 levels across these primagrafts, which allows us to test and compare the efficacies of ponatinib in pSHP2-high and pSHP2-low mouse models.
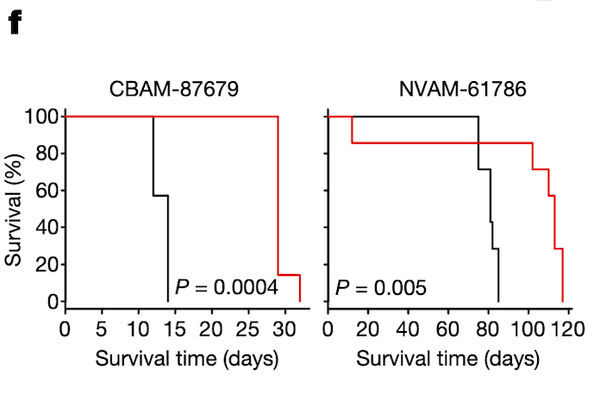
In Panel F, we test groups of mice with ponatinib treatment: one, CBAM-87679, has high levels of pSHP2; and the other, NVAM-61786, has relatively low levels of pSHP2 as shown in Panel E. The curve shows the proportion of mice surviving in the black control (no ponatinib) group versus the red ponatinib group. In the mice with high pSHP2 levels, we see that ponatinib treatment has a statistically significant effect in prolonging survival. In contrast, in the mice with low pSHP2 levels, we see that ponatinib treatment has no statistically significant effect. This concludes our proposal that pSHP2 levels may be used as a biomarker for selecting ponatinib treatments.
Reflection
Form and function
It's always important to pay close attention to the structure of a piece of writing to gain a sense of the intentions of its authors. In writing this particular paper, our primary aim was to illustrate the applications of the new datasets we had collected and how they might illuminate specific areas of treatment. As a result, we chose a "vignette" format in which we would highlight specific instances of the CCLE shining a new light on a biological relationship. Although this ultimately made it a bit hard to connect the different sections of the paper, we were still able to show the value that this kind of dataset would bring to the cancer research community. Besides, we also put some of the broader analyses – for instance, comparisons between the CCLE and other panels such as the GTEx and TCGA projects – in the supplementary figures and comments.
From a personal point of view, working on the CCLE was a fantastic opportunity to gain exposure to a wide variety of biological assays at the cutting-edge of genomics research. By working on MDM4 splicing and beyond, I gained an extensive understanding of the modern RNAseq workflow, from raw sequenced reads to data mining on exon-level splicing measurements. Moreover, contributing to the other parts of the paper allowed me to brush up on my general biology knowledge while also providing a rare experience to sharpen my data analytics skills.
The power of datasets such as the CCLE relies on the fact that cell lines are relatively stable and therefore able to propagated and re-profiled in different assays (although cell line stability is not perfect when considering mutations and drug responsiveness). As a result, we can perform additional measurements in the future to further deepen our characterization of cancer. For instance, since the publishing of the CCLE2, the collection has since been extended with another important component: quantitative proteome profiling, where expression levels of approximately 9,000 proteins were measured across 375 cell lines. In this paper, many of the analyses are compared with existing data – for instance, correlations between protein and gene expression levels, characterization of an MSI-specific proteomic signature, and many more. Future technologies will no doubt make the CCLE an even more comprehensive reference than it is today.
Genomics, genomics, genomics
With a few exceptions, the bulk of the CCLE's data is enabled by the breakthroughs of high-throughput technologies, genome sequencing in particular. As a result, it is a fitting example to examine how this technology has shaped the landscape of modern biology. Whereas sequencing in the public eye is commonly associated with mutation profiling, extensions such as RNAseq allow us to go beyond the genome. Moreover, with clever modifications and techniques, sequencing now allows us to capture massive amounts of biological data at unprecedented levels of detail – to name a few innovations, we can now infer how DNA itself is shaped inside our cells, profile millions of cells individually in parallel, and elucidate the structure of folded RNA. In the CCLE alone, sequencing technologies underpin panels not limited to mutation, copy number, RNA expression and splicing, miRNA expression, and DNA methylation. Moreover, all four related dependency datasets – Avana, DRIVE, Achilles, and Score – rely on massively parallel sequencing to assess gene depletion sensitivities. As sequencing prices continue to fall, more and more details of the machinery of the cell will be available, and more sophisticated methods will be required to make sense of these large new datasets.
The transformation of modern biology through large centralized repositories such as the CCLE has led to the coining of a new class of "hypothesis-free research" based on the methods used to derive insights from them. In every single vignette presented in our manuscript, the prior biological assumptions were limited – for instance, we did not go in expecting to find an association between SOX10 methylation and dependency in Figure 1, nor between MDM4 splicing and dependency in Figure 4. Rather, the method used in virtually all our examples was to simply compute an enormous amount of statistical associations and select the ones of particular interest (while of course being sure to correct for multiple hypothesis testing). After identifying interesting associations, we would bring ourselves up to date on the literature, which would often offer hints to the meaning of the association as well as possible extensions. As a result, our approach may be described best as one in which hypotheses are first generated and backed by bulk data, after which more specific experiments are employed for confirmation and elucidation. This top-down strategy provides powerful opportunities for discovery without bias. The costs and benefits of this approach remain to be seen in the coming years as the CCLE and its relatives grow in size and scope, but for the time being our understanding of cancer and the cell is made ever more precise.